The New York Times had an interesting article on bias in medical examinations titled “Failed Autopsies, False Arrests.” The article is about medical examiners investigating child death cases related to injuries, probing for evidence of mistreatment. It discusses the question of whether information that is not medically relevant, such as the race of the child and the caretaker’s relationship to the child, should be considered in these examinations. The article is critical of using this information, stating that it could allow bias to creep in. While their claim is certainly true, they neglect to mention that there are also costs of excluding this information.
In this post, I want to look at those costs. The New York Times neglected to mention any tradeoffs, making it seem as if there’s no reason to include the medically irrelevant information. My goal is to show that there’s a case to be made for both sides, and this is a question of tradeoffs. I want to give the case for the side the Times neglected, not with the goal of saying that approach is correct, but with the goal of understanding the tradeoff that is being made. I want to show how the medically irrelevant information could be incorporated into forensic analysis using Bayesian statistics, and how that could result in more innocent people being exonerated and more guilty people being convicted. This is not an easy question, but failing to see both sides would be a mistake.
The article references a study published in the Journal of Forensic Sciences on cognitive bias in forensic pathology decisions by Dror et al. According to the study, the authors "conducted an experiment with 133 forensic pathologists in which [they] tested whether knowledge of irrelevant non-medical information that should have no bearing on forensic pathologists' decisions influenced their manner of death determinations." They described the experiment as follows:
"We conducted an experiment with a sample of qualified forensic pathologists, who examined a hypothetical death case of a young child, with identical medical information but different extraneous medically irrelevant contextual information (the child was either Black and the mother's boyfriend was the caretaker, or the child was White and the grandmother was the caretaker)."
The pathologists were supposed to examine the data and determine if the child's injuries were the result of an accident, homicide, or if it could not be determined. Out of the 133 pathologists who completed the study, 78 said it was undetermined and 55 thought the data was conclusive. The problem is, those 55 didn't reach the same conclusion: 23 of them said it was an accident and 32 ruled it a homicide.
In addition, the study authors found that the assessed cause of death was heavily influenced by the contextual information they provided. This finding from the paper is summarized in the figure below. The graph showed that when the grandmother was a caretaker for a white child, it was more common to label the death as an accident, and when the mother’s boyfriend was the caretaker for a black child, it was more common to label the death as a homicide.

The New York Times discusses the study as follows:
"[It] touched on the very essence of the simmering debate over forensic pathology. It showed, its authors said, that judgments that ought to be based on science can become clouded by prejudice when medical examiners allow their findings to be affected by information that is not medically relevant. But many leaders in the field insist that medical examiners are obligated to consider the totality of the case before them—including statistics showing that boyfriends are more likely than blood relatives to commit child abuse."
These are important issues, but I think that the study missed the most important question. The study authors are right that additional information can allow prejudice to seep in—certainly something to be concerned about. However, we can also use that information, combined with Bayesian statistics, to make better decisions. Excluding information comes with costs and will result in us making worse decisions—potentially letting more guilty parties go free and imprisoning more innocent ones.
It's worth asking why we need Bayesian statistics at all. Why can't we just rely on science as the article suggests? The answer is that it's because science is not always conclusive. We can't always reach a conclusive answer from medical analysis. The study of pathologists showed that even when experts think the situation is certain, it can be far from that. The New York Times article admits as much:
"Yet these experts are far from infallible. As forensic science of all kinds faces scrutiny about its reliability, with blood spatter patterns, hair matching and even fingerprints no longer regarded as the irrefutable evidence they once were, the science of death has been roiled over the past year with questions about whether the work of medical examiners is affected by racial bias, preconceived expectations and the powerful influence of law enforcement."
That is, we're dealing with uncertainties, which we can model as probabilities. This is an important point that's worth delving into. People want certainty from the world, like medical examinations that show that a child’s death was definitely due to maltreatment or definitely not due to maltreatment. But the reality is that science is not so clear. Bayesian statistics is the field of dealing with this uncertainty.
Let's think about cases where a child dies by accident. As was the case covered in the New York Times story, sometimes a death could still look like maltreatment, possibly due to efforts to revive the child. Although we'll never know exactly what it looks like, one could imagine a probability distribution where it's very likely to look like an accident and increasingly unlikely to look like maltreatment. That is, there will be some cases where there are some injuries that could additionally suggest maltreatment and a few cases where the injuries look exactly like mistreatment. The distribution might look like this.

And we could imagine the reverse curve for deaths that were due to maltreatment. Most will look like they were caused by maltreatment, but some will appear accidental.

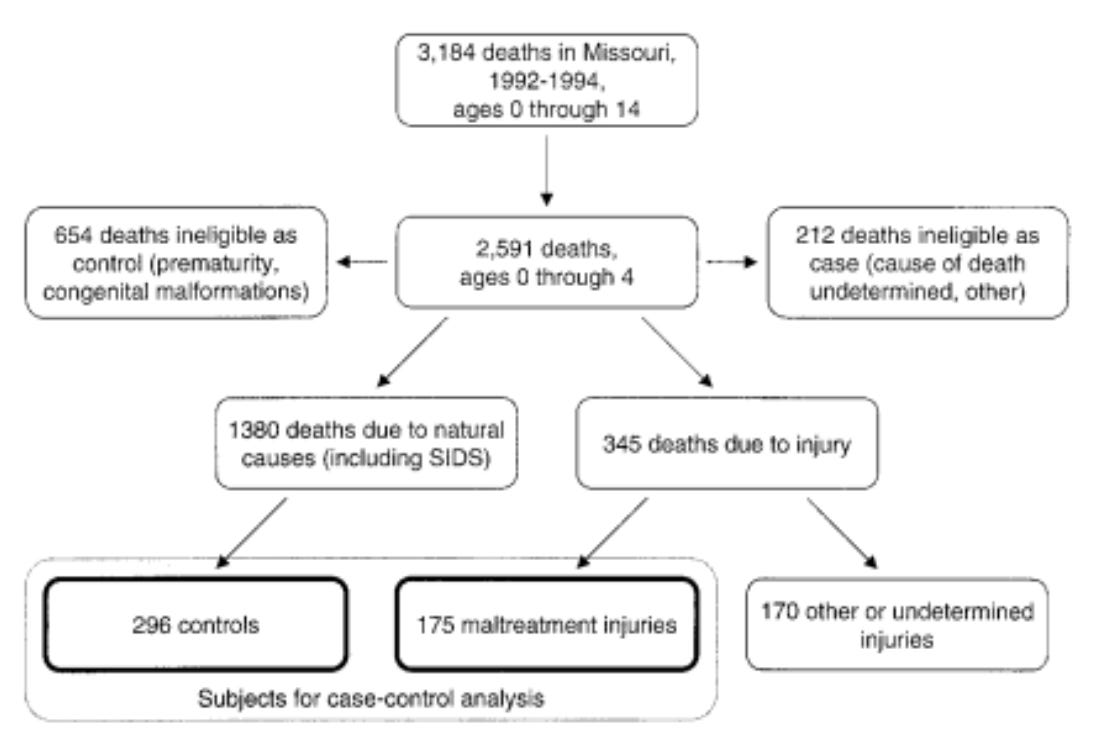
We can plug real-world data into these simulated probability distributions to see what real-world cases might look like. We can use the data from this study on household composition and risk of fatal child maltreatment. The study aimed to understand what risk factors existed for maltreatment and how significant those factors were. It looked at every death of a child under 5 years old in Missouri from Jan 1, 1992, to Dec 31, 1994. In the study, there were 2,591 deaths in that population. Most were due to natural causes, but 345 were due to injury. Of those, 175 were classified as maltreatment. For a point of comparison, they also selected 296 cases randomly from the ones who died from natural causes to use as a control.
They show how these deaths are broken down by demographic in the following table.
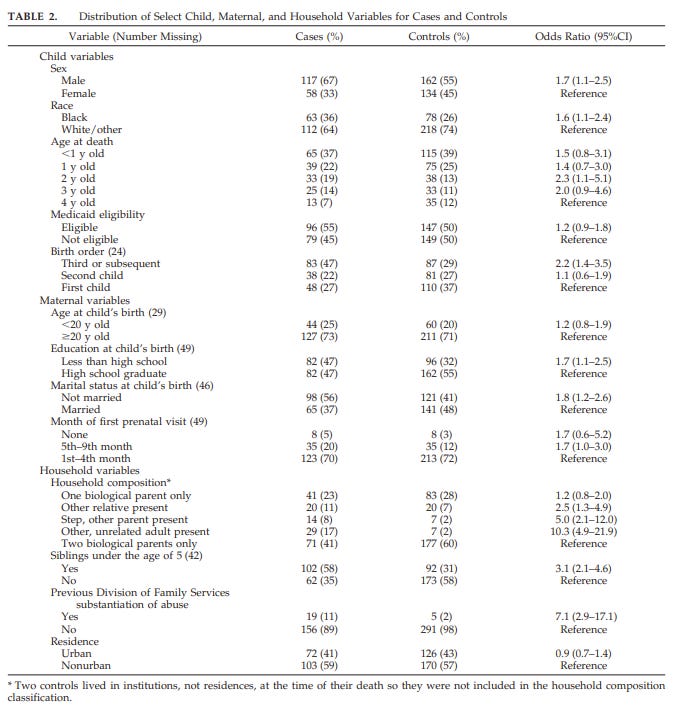
If you recall the study on pathologist bias, you'll remember that one group was described as being taken care of by the mother's boyfriend. In the Missouri study, that would correspond to the "Other, unrelated adult present" category. Let's look at how being under the care of an unrelated adult affects a child's risk of maltreatment and death. The Missouri study made multiple comparisons, but I'll only compare this group against the reference group—children under the care of two biological parents.
The study calculated an odds ratio for this group. This tells you how much more likely a child living with unrelated adults is to die from maltreatment versus living with two biological parents. The study found that this number is 10.3, meaning that a child under the care of an unrelated adult is over 10 times more likely to die from maltreatment than one under the care of their biological parents, according to this data.
This is a stunning result, but it's not an anomaly. There are numerous studies that have found similar results, such as child abuse by mothers' boyfriends: why the overrepresentation? which found that mother's boyfriends were responsible for 64 percent of non-parental abuse in single-parent families, despite performing less than 2 percent of non-parental child care. This broadly matches the study on household composition and risk of fatal child maltreatment. It's been addressed in media pieces like why are 'mothers boyfriends' so likely to kill.
This is the question that the New York Times article failed to address. The probability that children die from maltreatment varies drastically across populations. When assessing a case, should we use this information? If so, how? Let's start with the second question.
Now we can plug in the data. Let's start with the data of children under the care of biological parents. Based on the control group, we can see that about 60% of the children were under the care of their biological parents. We can also see that 41% of the children’s deaths due to maltreatment were living with both biological parents.
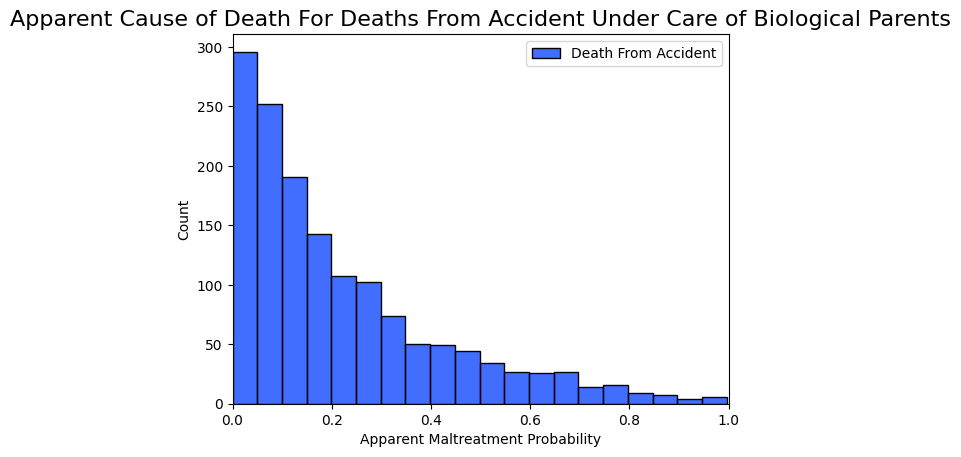
We know there were 2,591 total deaths of children between the ages of 0-4 in Missouri over this period. Based on the control group, we know that about 60% of the time a child is under the care of their biological parents. So we can say that 60% of them, or 1,549, lived with their biological parents when they died. We also know that 71 of those died from maltreatment, thus 1,478 died from all other causes, which includes accidents.
We can now sample 1,478 times from the simulated probability distribution to create a simulation of what all the accidental deaths would look like to a medical examiner. As you can see in Figure 5 below, the vast majority of cases show a very low apparent probability that death was due to maltreatment. This is what we expected because they weren't due to maltreatment. But there were some deaths that did appear to be from maltreatment, just by random chance.
We can do the same with maltreatment cases.

In this case, most appear to be from maltreatment, but some do not due to random chance.
Now, let's combine these two populations to see all cases under biological parents combined (deaths from accidents and maltreatment).

There were far more deaths that weren't due to maltreatment than those that were, so the maltreatment ones mostly get hidden in the graph, but you can see them on the maltreatment end of this graph.
Let's look at deaths under an unrelated adult's care. By looking at the deaths of children in Missouri in Table 1, we can calculate that only about 2.4% of the deaths were under the supervision of an unrelated adult. That would be 61 given our sample of 2,591 total deaths. 32 of these would be due to accident and 29 would be from maltreatment. We'll plot the deaths due to accidents first.
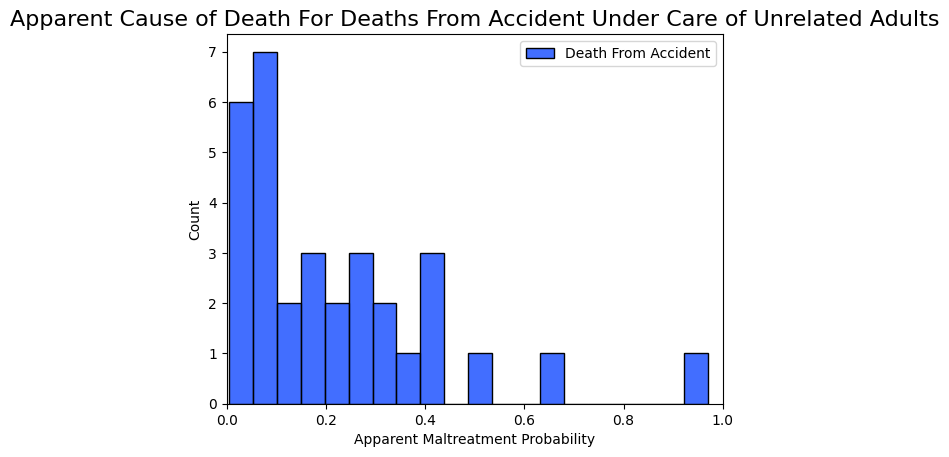
Because it's less common for children to be under the care of unrelated adults, there are fewer examples in this graph.
Now we'll plot the ones who died from maltreatment.

Then we can combine all the deaths under unrelated adults.

There are far fewer accidental deaths relative to deaths from maltreatment for children under the care of an unrelated adult. So the deaths from maltreatment are more pronounced in this graph.
Now let's combine all of the deaths together.
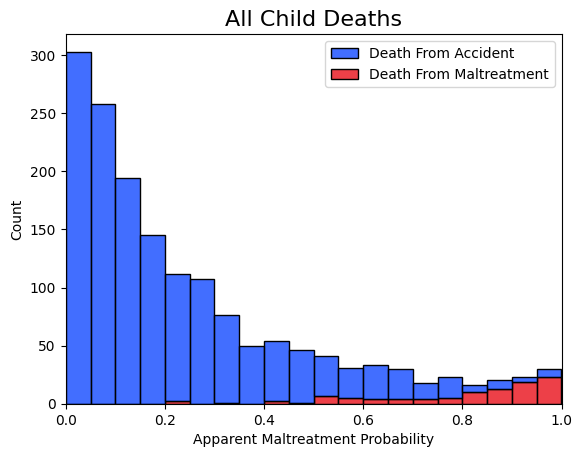
This is what we expect to see because, as the Missouri study showed, the vast majority of child deaths aren't due to maltreatment. Thus in the vast majority of cases, there is little-to-no evidence of maltreatment. There are, however, some clear examples of maltreatment and many results in the middle.
This graph has incorporated all of what the Dror study called "medically relevant" information. If this is the only information we use, this is all we would have to determine someone's guilt. The next step would be to think about at what point we would consider someone guilty. There's no right answer here. To better understand the implications, we can make a precision-recall curve. I won't go into all the details here, but at a high level, this will tell us the precision and recall at different thresholds. In this case, "precision" means the percentage of convicted people who were truly guilty. "Recall" means the percentage of those who are guilty who are convicted.
Both are things we want to maximize as much as possible—we don’t want innocent people behind bars and we also don’t want anyone who’s guilty walking free. But there's a tradeoff—if we set the threshold too low, we may identify lots of guilty people (high recall) but we would also arrest some innocent people (low precision) as well. Conversely, if the threshold were too high, we would avoid falsely convicting but could let many guilty people walk free. It’s important to find the right balance. A precision-recall curve helps us visualize this tradeoff.

To make it more concrete, let's apply actual numbers to this. All we have to do is select a threshold for determining when someone is guilty. We use the term "beyond a reasonable doubt" because we don't like the idea of putting a specific number on it. But that doesn't mean that there isn't a number—just that we don't like to think in those terms.
My guess is that the number in people's hearts is somewhere around 90-95%. I don’t think people admit this to themselves—I think what happens is when they reach 90-95%, they tell themselves they're 100% sure to remove their internal unease and vote to convict. If you think I'm mistaken, that's fine. You can re-run the same analysis with whatever threshold—the specific numbers will change, but the underlying idea won't.

The figure above shows the number of people in each category given the guilt threshold of 95%. Note that these specific numbers are sensitive to the distribution we simulated, so they are only a simulation. As you can see, 1503 people were innocent and believed to be innocent, and 23 were guilty and believed to be guilty. But 77 people were guilty and believed to be innocent and 7 were innocent but believed to be guilty.
Now, let's talk about how to incorporate new information into our decision-making. There is a field of math known as Bayesian statistics that deals with this exact problem. I won't go through all the details here—you can check out the details at that link to Wikipedia if you're interested. But at a high level, it's a branch of math dealing with how to update our beliefs based on additional information.
We take the probability that the child was maltreated that we got from the medical examiner and apply a "Bayesian update", where we multiply that probability by the probability we learned from the background information in the Missouri study. This allows us to chain probabilities and provides more accurate results.
Imagine a child who died an accidental death in their biological parents' care but received head trauma in a way that looks like maltreatment. The medical examiner looks at the child and concludes there is a 75% chance the child died of maltreatment.
However, a child dying of maltreatment is very rare under the care of biological parents. So we multiply the 75% that we got from the medical examiner by the ratio of the probability that the child’s caretaker was biological given it was maltreated over the probability that it was biological, and we come up with a new probability.
That can be hard to follow with words. Mathematically, it would look like this:
We can do the same thing for an unrelated adult. Only this time we multiply the prior, which is the probability that the child was maltreated as determined by the medical examiner, by the probability it was an unrelated adult given it was maltreated over the total probability it was an unrelated adult
We used this background information to calculate a new probability for every case. Then we'll turn that into a precision-recall curve again. This time we'll include both the initial one and the one with additional information.

You can see in the figure above that with more information we can consistently get more precision and more recall. Let's look at the results with concrete numbers.
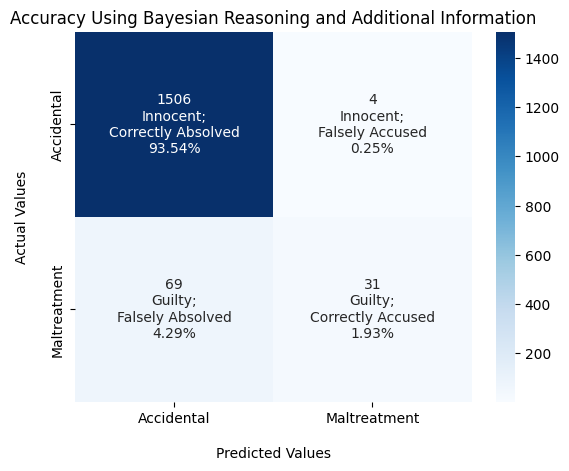
As you can see, when comparing this figure to the one with only medical information, every category has improved. The number of falsely accused people has gone from 7 to 4, the number of wrongly acquitted has decreased from 77 to 69, and the number of correctly accused went up from 23 to 31. It seems almost impossible for every category to perform better, but that's the power of using additional information—we can improve all situations.
To be clear, none of this means it is the medical examiner who must incorporate all of this information. In theory, the contextual information could be passed on to anyone, such as a judge or a jury. This only works if the medical examiner can pass on their information probabilistically though. If they say “There is a 75% chance this was homicide” that probability can be combined with other information. They could also use probabilistic language, such as “this was likely a homicide”, but it becomes difficult to combine the different pieces without an explicit percentage.
Conclusion
It's important to highlight the assumptions built into this simulation and clarify what effect they have. The curves showing the apparent causes of death in Figures 2 and 3 were simulated. There is no way to know what the true graph would look like. But the general idea that deaths from maltreatment will look more like they were due to maltreatment and deaths from an accident will look more like deaths from an accident, seems certainly true. If this weren't the case, then the entire practice of forensic pathology would be pointless. And once you agree to that, the exact slope of the curve will change the final numbers, but won't change the overall point.
Similarly, the threshold for guilt was a guess. I think 90-95% is a reasonable guess, but perhaps I'm wrong. However, you can see in the precision-recall curve that the Bayesian approach has higher values, so it doesn't matter where you put the actual threshold—the overall point will still hold.
There are several important caveats to be aware of when applying this type of data-driven analysis. The primary one is the famous adage: "Garbage in, garbage out". The whole analysis begins with police data, and any bias in the arrest rates will propagate through the analytical process. If police believe mothers' boyfriends are more likely to mistreat a child, they are more likely to make an arrest. This arrest feeds into academic studies like the one I pulled data from, which eventually get fed into an analysis.
It's hard, bordering on impossible, to remove all bias from data. But before we throw the whole process out, let's think about how accurate the data needs to be. For this kind of analysis to be valuable, it requires that different populations have different base rates (i.e., different rates of committing a crime). Do you think that bias explains the entire difference? Are mothers equally likely to abuse their children as their boyfriends are? If not, then the technique can still add value.
The next question is, what data should we use? Any data could cause a positive feedback loop. We use this analysis to determine that certain groups are more likely to offend, and then we arrest more of that group. There are ways to prevent this effect from snowballing, but it's still something worth being aware of. It's important to use accurate and relevant data, and it's not obvious what that data is. Does data about boyfriends in Missouri collected in the 1990s apply to boyfriends in New York today? Does it apply to the father's girlfriend? Or to an Au Pair?
This points to possibly the hardest question of all. Unless you've been living under a rock for the last decade, the following won't come as a shock: classifying people into groups is hard. Which groups we use and who gets to decide them are of great importance. The Missouri study talked about "unrelated adults" as a group—does it make sense to combine the mother's boyfriend into the same group as the live-in nanny? It's not obvious that "unrelated adults" is the right grouping. What about the caregiver’s age, race, or other demographic information? Who gets to choose which groupings to make and where to draw the lines within the groupings?
Despite its limitations, this approach can have a significant, positive effect. We're talking about arresting more guilty people and freeing more innocent ones. But we have to decide which categories are acceptable and which are not. How many child abusers are worth leaving unpunished to remain gender-neutral? How many innocent people would you lock up to be race-neutral? I'm not arguing for one side or the other. I'm not saying the answer is obvious. I'm arguing that we should understand the full picture and be clear-eyed about the tradeoffs we're making. These are tough questions.

P.S.
This isn't directly related to the above, but it's hard not to read this study and be disappointed by it. The study combined two variables - race and the caretaker's relationship to the child - in a way that they cannot be separated. They put the black child with the mother's boyfriend as the caretaker in one group and the white child with the grandmother as the caretaker. By combining them, it's impossible to see which factors influenced the pathologists. If the pathologists were using both pieces of information, or even ignoring race completely, the results could still be misinterpreted as showing racial bias. Based on the Missouri study data, the relationship between the caretaker and child is far, far more important than the child's race. But in the highlights and elsewhere they focused on the racial aspect, even though it's not clear from the data. It's hard not to look at it as purposely designed to make forensic pathologists look racist.


